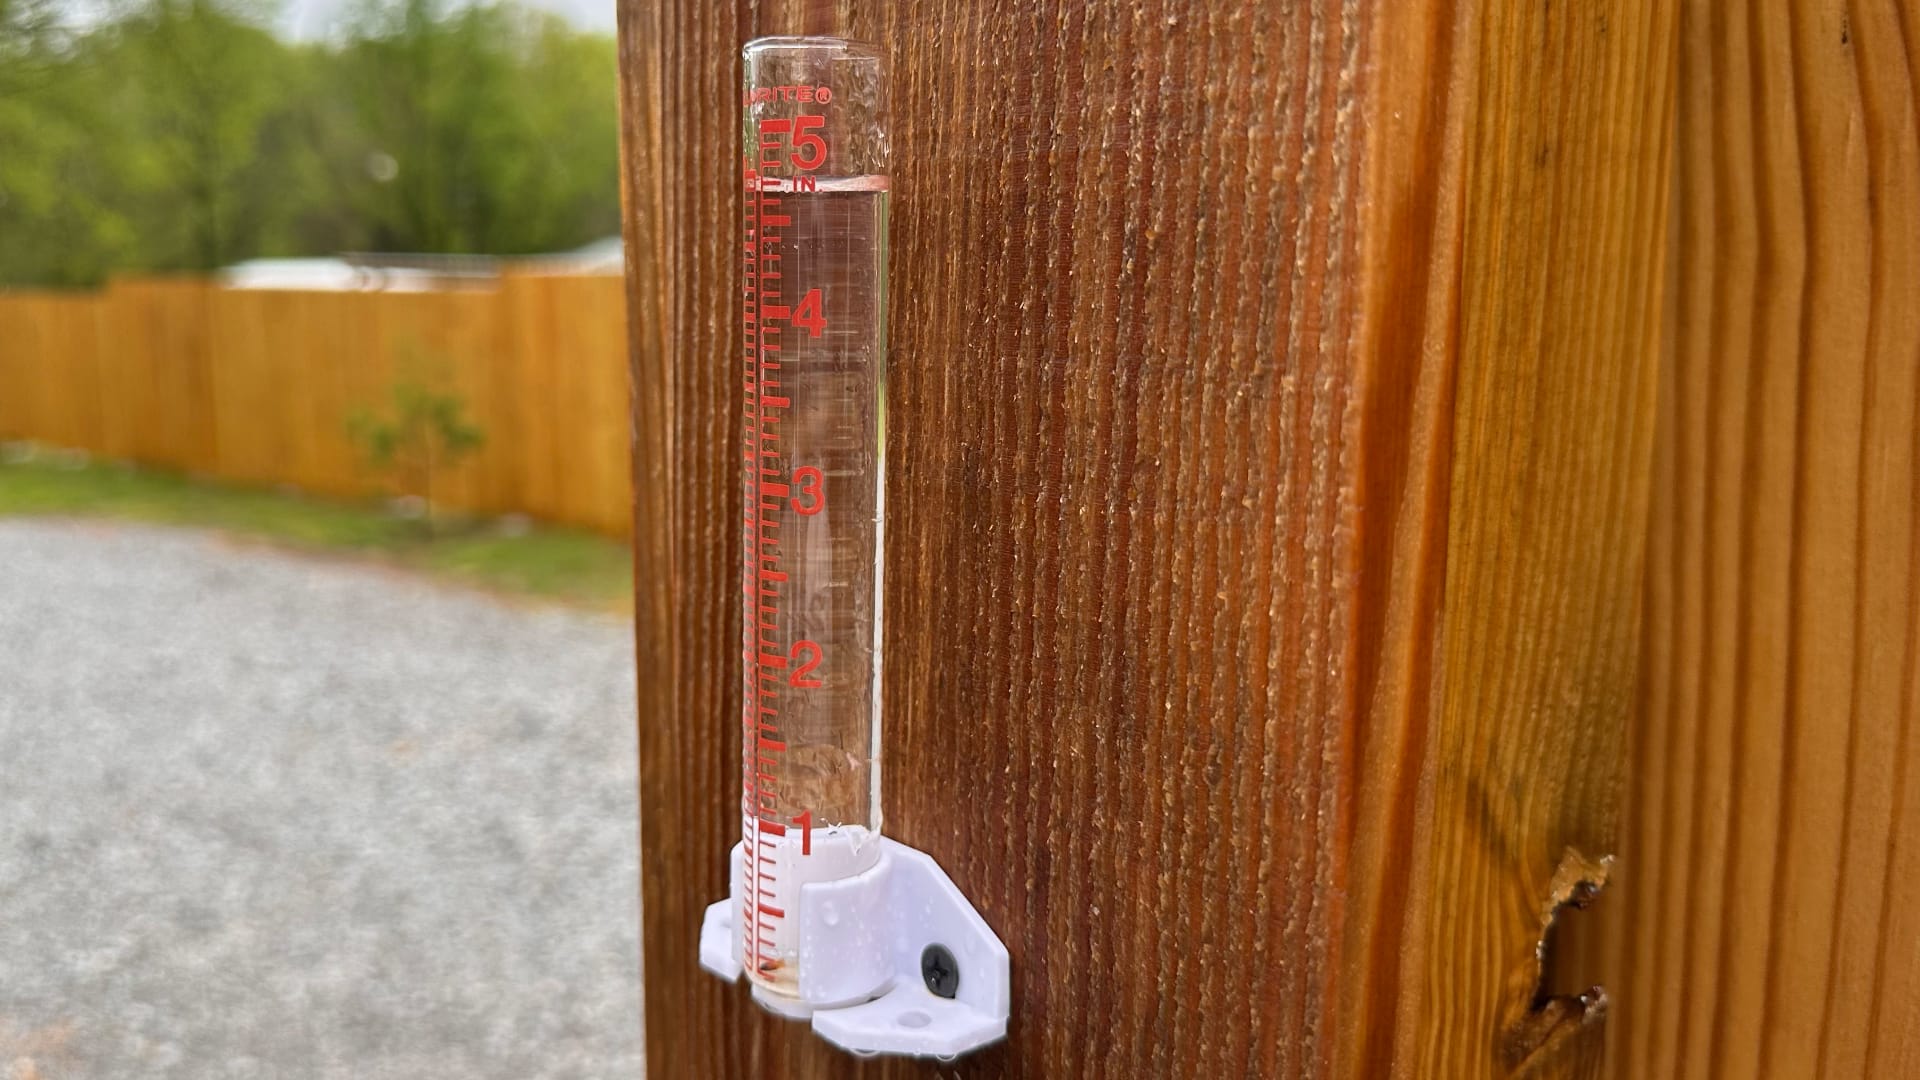
📸 Photo Description
This image shows a rain gauge mounted on a wooden post or fence. A rain gauge is a clear tube with numbers and markings that measure how much rain falls from the sky. The tube collects rainwater in a white container at the bottom, and you can read the measurement by looking at where the water level reaches on the numbered scale.
🔬 Scientific Phenomena
Anchoring Phenomenon: How do scientists measure the amount of rain that falls?
Rain gauges measure precipitation by collecting falling water in a standardized container. When rain falls, gravity pulls the water droplets downward into the gauge's opening. The collected water rises in the tube to a height that corresponds to the rainfall amount. This simple tool helps meteorologists track weather patterns, predict flooding, and understand local climate. Students can observe real precipitation data collection happening right in their own schoolyard, making abstract weather concepts concrete and measurable.
📚 Core Science Concepts
- Precipitation: Water that falls from clouds to Earth in the form of rain, snow, sleet, or hail. A rain gauge specifically measures liquid precipitation.
- Measurement & Data: Scientists use tools like rain gauges to collect numerical data about weather. These measurements help us compare rainfall amounts over time and between locations.
- Weather Patterns: By recording rain measurements regularly, students can identify patterns—such as which months get the most rain or how rainfall varies from week to week.
- The Water Cycle: Rain is a key part of how water moves from the atmosphere back to Earth's surface, connecting evaporation, condensation, and precipitation.
Pedagogical Tip:
Make the abstract concept of "1 inch of rain" tangible by using a clear container at home or school to collect actual rainfall. Let students measure it with a ruler alongside the rain gauge. This bridges the gap between the tool and the real water cycle students experience daily.
UDL Suggestions:
Multiple Means of Representation: Provide both a physical rain gauge demonstration AND a visual poster showing the water cycle with arrows. Some students process spatial information better through pictures; others benefit from handling the actual tool.
Multiple Means of Action & Expression: Allow students to record data by drawing water level pictures, writing numbers, or building a model gauge from a clear cup and sticker markings—choose the method that matches their strengths.
🎓 NGSS Connections
Performance Expectation:
3-ESS2-1: Represent data in tables and graphical displays to describe typical weather conditions expected during a particular season.
Disciplinary Core Ideas:
- (Weather and Climate)
Crosscutting Concepts:
- (Students identify precipitation patterns over time)
- (Students measure rainfall amounts using standard units)
💬 Discussion Questions
- "What do you think happens to the rainwater after it collects in the gauge? Where does it go?" (Bloom's: Understand | DOK: 1)
- "Why do you think scientists measure rain instead of just looking at the sky and guessing how much fell?" (Bloom's: Analyze | DOK: 2)
- "If we measured rain every day for a month, what patterns might we notice? How could we organize that information?" (Bloom's: Apply | DOK: 2)
- "If two rain gauges in different neighborhoods collected different amounts of rain on the same day, what might explain the difference?" (Bloom's: Evaluate | DOK: 3)
📖 Vocabulary
- Rain gauge: A tool that measures how much rain falls from the sky.
- Precipitation: Water that falls from clouds in the form of rain, snow, sleet, or hail.
- Measurement: Using tools and numbers to find out how much or how long something is.
- Weather: What the air and sky are like at a particular time and place (sunny, rainy, hot, cold, etc.).
- Data: Information collected by scientists through observations and measurements.
🌡️ Extension Activities
- Create a Classroom Rain Gauge: Provide clear plastic bottles, rulers, and permanent markers. Have students work in pairs to build their own rain gauges and place them around the schoolyard (with teacher permission). Over two weeks, students measure and record rainfall daily, then create a bar graph comparing totals.
- Water Cycle Journey: Students become water droplets and act out the water cycle in a movement activity. One student is "rain" in the gauge, another "sun" causes evaporation, another "cloud" forms condensation, and the cycle repeats. Discuss how the rain gauge captures just one part of this continuous cycle.
- Rain Prediction & Observation: Before a rainy day, ask students to predict how much rain will fall. After the rain, compare predictions to actual measurements. Repeat over several weeks and create a bulletin board showing "Our Rain Predictions vs. Reality."
🔍 Zoom In / Zoom Out Concepts
Zoom In: Water Droplets & Evaporation
When you zoom in really close—closer than your eyes can see—raindrops are made of millions of tiny water molecules. Each molecule is so small we need special tools called microscopes to see them. When the sun heats water in puddles, lakes, or oceans, those invisible molecules escape into the air as water vapor. This invisible process is called evaporation. The rain gauge captures the water after it falls, but it all started as invisible vapor floating in the sky!
Zoom Out: Watersheds & Water Systems
When you zoom out and look at the whole picture, a single rain gauge measures precipitation that falls on just one small spot. But all that rainwater flows downhill into streams, rivers, and eventually into larger bodies of water like lakes and oceans. This area where water drains is called a watershed. Rain falling in your schoolyard might eventually flow into your community's water system that people use for drinking, farming, and industry. The rain gauge helps scientists understand how much water enters these larger systems!
🤔 Potential Student Misconceptions
Misconception 1: "The rain gauge makes the rain fall."
Clarification: A rain gauge is a measuring tool, not a rain maker! It simply collects and measures rain that naturally falls from clouds. The gauge itself doesn't create or attract rain. It's like a cup you use to measure milk—the cup doesn't make the milk; it just helps you know how much you have.
Misconception 2: "All the water in the gauge stays there forever."
Clarification: After rain is measured and recorded, the water doesn't stay in the gauge permanently. Scientists empty it to prepare for the next rainfall. Some water also evaporates back into the air on sunny days. The gauge is a temporary collector, not a storage tank.
Misconception 3: "Rain gauges measure rain differently depending on where they are."
Clarification: Rain gauges are designed to be standardized—they all measure the same way because they have the same size opening at the top and the same marked numbers. So if two rain gauges measure rain from the same rainstorm in the same location, they should show the same amount. (Different amounts in different locations is normal because storms don't drop equal rain everywhere!)
🔗 Cross-Curricular Ideas
Math Connection: Graphing & Comparison
Students record daily or weekly rainfall measurements and create bar graphs or line graphs showing precipitation over time. They can compare rainfall between different weeks or months, finding the highest and lowest amounts, calculating totals, and using mathematical language like "more than," "less than," and "equal to." This integrates data visualization with measurement standards.
ELA Connection: Weather Journals & Storytelling
Students write daily observation journals describing the weather and rain gauge measurements in sentence form. They can also read and discuss books about rain (like Come On, Rain!) and write their own creative stories about a raindrop's journey from cloud to gauge to river. This combines descriptive writing, sequencing, and literary response.
Social Studies Connection: Community Water Usage
Students research where their community's drinking water comes from and how rainfall contributes to water supplies. They can interview local workers (water department employees, gardeners, farmers) about how rain affects their jobs. This connects precipitation measurement to real-world community needs and careers.
Art Connection: Precipitation Representation
Students create mixed-media artwork showing the water cycle or rainfall. They might paint a rainstorm scene, create a collage showing clouds and rain gauges, or use blue watercolor to represent different rainfall amounts. They could also design their own rain gauge with creative decorations while keeping the measurement markings accurate.
🚀 STEM Career Connection
- Meteorologist — Studies the atmosphere to work out what the weather will do next.
- Try it: Record daily rainfall amounts for a month and create a bar graph to show the total rainfall each week. (Practice: Analyzing and Interpreting Data)
- Tools: weather balloons, radar, rain gauges, computer models
- Where they work: weather stations, airports, television studios, research centres
- Meet one: Marshall Shepherd — Why cities make their own weather, and why some neighbourhoods flood before others.
- Median pay: /year — "Atmospheric and space scientists"
- Hydrologist — Follows water — where it falls, where it goes underground, and where it comes out again.
- Try it: Investigate how different surfaces affect water runoff by pouring the same amount of water onto a sponge, a rock, and soil. (Practice: Analyzing and Interpreting Data)
- Tools: stream gauges, well probes, flow meters, rain gauges
- Where they work: rivers and reservoirs, water utilities, government surveys, universities
- Meet one: Newsha Ajami — How cities can use water more wisely, especially when there is not enough of it.
- Median pay: /year — "Hydrologists"
Wage figures are median annual wages for the U.S. occupation named after each one, from the U.S. Bureau of Labor Statistics, Occupational Employment and Wage Statistics (OEWS), national, May 2025. Several careers share one occupation, so their figures match.