📸 Photo Description
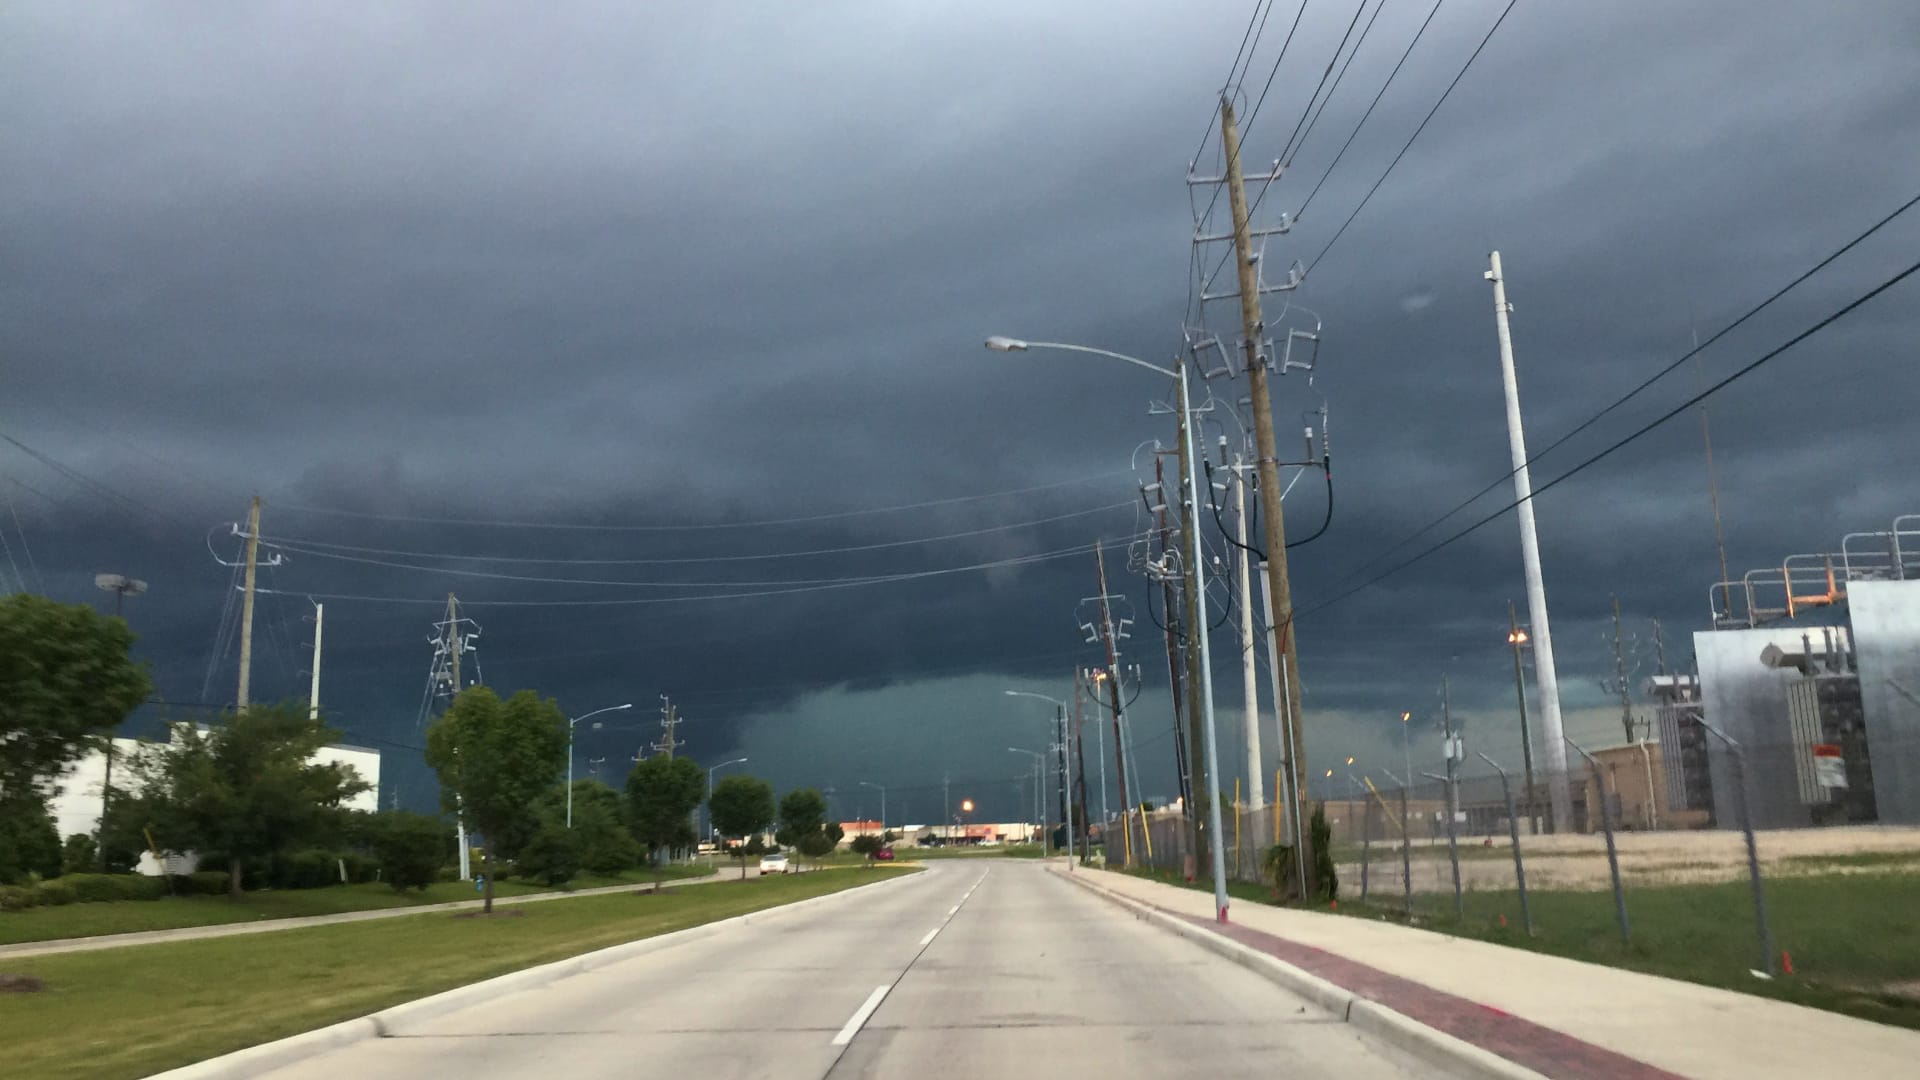
This image shows a dramatic storm moving into a community on a clear day. Dark, heavy clouds are building up over a lake or large body of water in the distance, while the foreground shows streets, power lines, and green grass still in sunshine. The dark clouds tell us that rain and strong winds are coming very soon.
🔬 Scientific Phenomena
Anchoring Phenomenon: Storm Formation and Severe Weather Development
This image captures the moment when warm, moist air rises and cools in the atmosphere, causing water vapor to condense into clouds. When clouds develop rapidly and become very dark (like those visible over the water), it indicates strong updrafts and the potential for severe weather. The contrast between the clear sky in the foreground and the dark, towering clouds in the background shows how weather systems move across landscapes. This is happening because of temperature and pressure differences in the atmosphere—warmer air near the ground rises, and as it rises, it cools and the moisture in it condenses, forming the visible storm clouds.
📚 Core Science Concepts
- Weather Patterns and Changes: Weather can change quickly, and we can observe signs that storms are approaching by watching cloud development, sky color, and wind patterns.
- The Water Cycle: Water evaporates from the lake and other sources, rises into the atmosphere, cools, and condenses into clouds. This process is visible in the formation of these storm clouds.
- Clouds and Precipitation: Different types of clouds bring different weather. Dark, thick clouds like cumulonimbus clouds shown here typically bring heavy rain, wind, and sometimes severe weather.
- Atmospheric Conditions: Air temperature, moisture, and pressure changes drive weather formation and movement across Earth's surface.
Pedagogical Tip:
Help students make personal connections by asking them to recall their own experiences with sudden storms. Create a "Storm Observation Chart" where students document changes they notice in the sky before and during storms at home or school. This builds observational skills and weather literacy that will support their understanding of atmospheric processes.
UDL Suggestions:
Representation: Provide students with labeled diagrams showing cloud formation stages, weather symbols, and atmospheric layers to support varied learning styles. Use animated videos alongside still images so visual learners and students needing movement breaks can access the content in different ways.
Action & Expression: Offer multiple ways for students to demonstrate learning: drawing storm diagrams, acting out cloud formation, creating weather data charts, or verbally explaining what they observe. This allows students with different strengths to show understanding.
Engagement: Connect the phenomenon to student safety (what to do during storms) and local community preparedness. This real-world relevance increases motivation and demonstrates why weather science matters in their lives.
🎓 NGSS Connections
Performance Expectation:
3-ESS2-1: Represent data in tables and graphical displays to describe typical weather conditions expected during a particular season. (Weather & Climate)
Disciplinary Core Ideas:
- Weather and Climate—Scientists record patterns of the Sun, Moon, and stars, and weather patterns can be observed, recorded, and predicted.
- Natural Hazards—Severe weather (storms, hurricanes, tornadoes) can be observed and can cause damage; people can prepare for and respond to hazardous weather.
Crosscutting Concepts:
- — Weather patterns change over time and can be observed and predicted.
- — Temperature and moisture differences cause weather to form and change.
- — Storms can vary in size and intensity, affecting different areas differently.
💬 Discussion Questions
- What do you think is happening in the sky right now in this picture, and why do you think the clouds look so dark? (Bloom's: Understand | DOK: 1)
- How do you think the weather in the background (over the water) will change the weather in the foreground (where the road is) in the next hour? (Bloom's: Predict | DOK: 2)
- What evidence in this photo tells us that a storm is coming? What would you do to prepare if you saw a sky like this? (Bloom's: Analyze | DOK: 2)
- Why do you think dark clouds bring rain, while light, puffy clouds might not? Where does the water in clouds come from? (Bloom's: Analyze | DOK: 3)
📖 Vocabulary
- Storm: A weather event with strong winds, heavy rain, thunder, and lightning that can be dangerous.
- Clouds: Visible masses of water droplets or ice crystals floating in the sky formed when water vapor cools and condenses.
- Weather: The condition of the atmosphere at a particular place and time, including temperature, wind, and precipitation.
- Precipitation: Water falling from clouds to Earth in the form of rain, snow, sleet, or hail.
- Atmosphere: The layer of air that surrounds Earth and protects us; where weather happens.
- Forecast: A prediction of what the weather will be like in the future based on observations and data.
🌡️ Extension Activities
Activity 1: Storm Observation Log
Have students create a simple weather observation chart over 1-2 weeks. Each day, they sketch the sky, record the temperature, describe cloud types, and note any weather changes. When a storm approaches, have them make hourly observations to document how quickly conditions change. This builds data collection skills and helps them recognize storm patterns.
Activity 2: Cloud Formation in a Bottle
Demonstrate cloud formation using a clear plastic bottle, warm water, a match, and ice. When students see water vapor condense into visible clouds inside the bottle, they'll understand the process happening in the photograph. Discuss how the "warm air" (from hot water) and "cold air" (from ice) create the same conditions as in real storms.
Activity 3: Storm Safety Preparation Plan
Working in small groups, have students create a poster or digital presentation about how their family or school should prepare for severe weather. Include observations that warn of approaching storms, safety steps, and supplies needed. This applies their learning to real-world preparedness and addresses the natural hazards aspect of the NGSS standard.
🔍 Zoom In / Zoom Out Concepts
Zoom In: The Microscopic View
When you zoom in very close to a storm cloud, you'd see billions of tiny water droplets—so small you can't see them with your eyes! Each droplet forms when water vapor (an invisible gas) touches a speck of dust or salt in the air and cools down. The droplet sticks to the dust particle like morning dew on a spider web. When millions and millions of these tiny droplets cluster together, they become visible as a cloud. The darker the cloud looks, the more water droplets are packed tightly together, blocking sunlight from passing through!
Zoom Out: The Planetary System
This single storm is part of Earth's global weather system, which is driven by the Sun's energy and Earth's rotation. The Sun heats oceans and lakes (like the one in the photo), causing water to evaporate. Warm air currents move this moisture across continents and oceans. When this moist air meets cooler air or mountains, it rises and cools, forming the storm clouds we see. This same process happens everywhere on Earth—from tropical rainforests to deserts to polar regions—constantly cycling water and energy around our planet. One storm in one location is connected to weather patterns happening thousands of miles away!
🤔 Potential Student Misconceptions
Misconception 1: "Clouds are made of air/fog"
Many Third Graders think clouds are just thick air or fog floating in the sky. They may not realize clouds are made of tiny water droplets.
Clarification: Clouds are billions of water droplets stuck together. The water came from lakes, oceans, and rivers that evaporated into an invisible gas. When that gas cools down high in the sky, it turns back into tiny water droplets we can see as clouds.
Misconception 2: "Dark clouds are closer to Earth than light clouds"
Students often think dark clouds look dark because they're closer to us, like how a dark object looks darker when it's near you.
Clarification: Dark clouds look dark because they have SO many water droplets packed together that sunlight can't shine through them—like how a thick blanket blocks light. Light, puffy clouds have fewer water droplets spread out, so light can pass through more easily.
Misconception 3: "We can predict exactly when and where a storm will hit"
Third Graders may think weather forecasters know for certain what will happen, since they see weather reports on TV.
Clarification: Weather forecasters make educated guesses based on patterns and data they collect, but weather is very complicated. They can tell us a storm is likely to come, but sometimes storms move or change in surprising ways. That's why scientists keep studying weather!
🔗 Cross-Curricular Ideas
Math Connection: Data Collection and Graphing
Have students collect weather data (temperature, cloud cover, wind) every day for two weeks and create bar graphs or pictographs showing patterns. They can compare "storm days" to "sunny days" and calculate how many days had different weather conditions. This reinforces graphing skills while connecting to real-world data scientists use.
ELA Connection: Storm Poetry and Weather Journals
Students can write descriptive poems or journal entries about what they observe in the photograph, using sensory words (dark, heavy, dangerous, peaceful contrast). Read aloud books like Come On, Rain! and have students write their own narrative about a storm from a character's perspective, building vocabulary and creative writing skills while exploring the phenomenon.
Social Studies Connection: Community Preparedness and Safety
Connect storm science to how communities prepare for severe weather. Students can interview family members about their storm safety plan, research how their town's emergency services prepare, or create a community guide for neighbors. This builds civic awareness and shows how science knowledge helps keep people safe.
Art Connection: Weather Observation Sketching
Have students create a series of sky sketches over time, showing how clouds change from day to day or hour by hour before a storm. They can use watercolors, pastels, or colored pencils to capture the dramatic contrast in this photograph. Display the sketches in sequence to show storm development, combining art with scientific observation and documentation.
🚀 STEM Career Connection
- Meteorologist — Studies the atmosphere to work out what the weather will do next.
- Try it: Design a simple tool that could help you measure how windy it is, like a small pinwheel. (Practice: Constructing Explanations and Designing Solutions)
- Tools: weather balloons, radar, rain gauges, computer models
- Where they work: weather stations, airports, television studios, research centres
- Meet one: Marshall Shepherd — Why cities make their own weather, and why some neighbourhoods flood before others.
- Median pay: /year — "Atmospheric and space scientists"
- Hydrologist — Follows water — where it falls, where it goes underground, and where it comes out again.
- Try it: Draw a picture showing how water moves from the sky to the ground and then back up again, explaining each step. (Practice: Constructing Explanations and Designing Solutions)
- Tools: stream gauges, well probes, flow meters, rain gauges
- Where they work: rivers and reservoirs, water utilities, government surveys, universities
- Meet one: Newsha Ajami — How cities can use water more wisely, especially when there is not enough of it.
- Median pay: /year — "Hydrologists"
Wage figures are median annual wages for the U.S. occupation named after each one, from the U.S. Bureau of Labor Statistics, Occupational Employment and Wage Statistics (OEWS), national, May 2025. Several careers share one occupation, so their figures match.